Analytics
The Analytics page shows how your contract process is performing: volume, cycle time and negotiation.
Plan and permission
Analytics is part of the Enterprise plan and needs the Analytics: view permission.
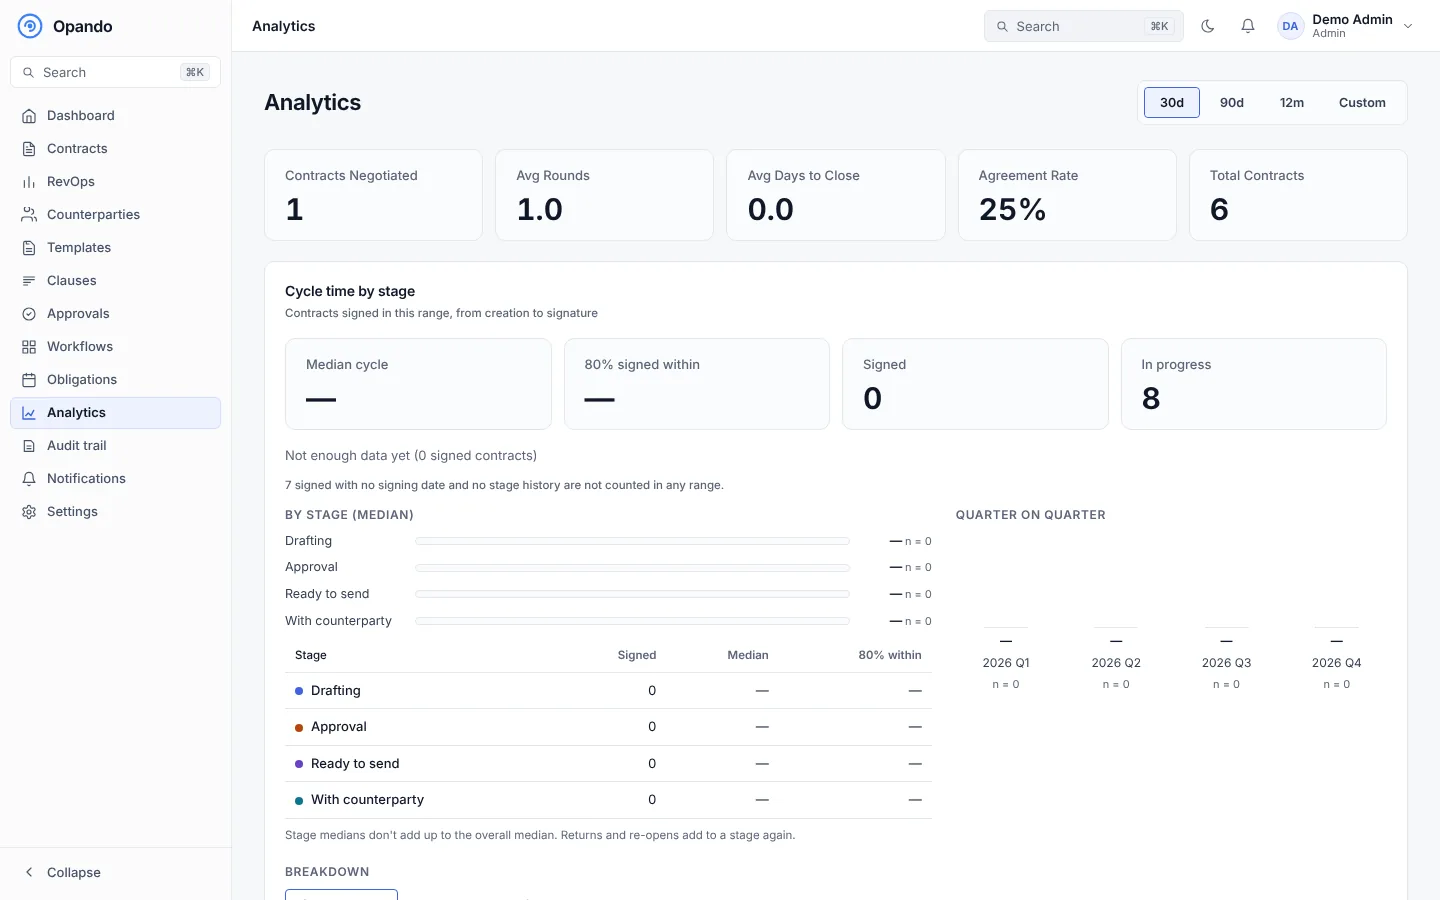
Choose a date range at the top (for example last 30 or 90 days, or a custom range).
Key figures
Contracts negotiated, average rounds, average days to close, agreement rate and total contracts.
Cycle time
Cycle time by stage covers contracts signed in the range, from creation to signature:
- The median cycle, how many contracts are in progress, and the median days per stage (drafting, approval, ready to send, with counterparty).
- A breakdown by contract type and department.
- Quarter on quarter: the median cycle per quarter.
Stage medians don't add up to the overall median, because returns and re-opens add time to a stage again. Contracts signed without stage history (for example uploaded signed contracts) are listed but not counted.
Contract volume and status
Contracts created over time and a status breakdown for the period.
Usage
Contracts created, AI assist uses and signature packets over the period, against your plan.
Negotiation
Negotiation rounds over time and the most disputed clauses. Data appears after your first completed negotiation and updates nightly.
For revenue-focused analysis, see RevOps.